Descriptive Statistics
I.TYPES OF DATA
-
Categorical:
- Categorical data represents groups or categories.
- Example:
- Car brands: Audi, Toyota,..
- Answer to yes/no questions: yes and no
-
Numerical:
- Discrete
- Continuous
- Numerical data represents numbers. It is devided into two groups: discrete and continuous. Discrete data can be usually counted in a finite matter, while continuous is infinite and impossible to count.
- Examples:
- Discrete: # of children you want to have
- Continuous: weight, height
II.LEVELS OF MEASUREMENT
-
Qualitative:
- Nominal: level represents categories that cannot be put in any order
- Ordinal: level represents categories that can be ordered
- Example:
- Nominal: four seasons (winter, spring, summer, autumn)
- Ordinal: rating your meal (disgusting, unappetizing, neutral, tasty and delicious)
-
Quantitative:
- Interval: represents "numbers" and does not have a true zero
- Ratio: represents "numbers" and have a true zero
- Examples:
- Intervals: degree Celsius and Fahrenheit
- Ratio: degree Kelvin, length
III.GRAPH AND TABLES THAT REPRESENT CATEGORICAL VARIABLES
| Frequency distribution tables | Bar Charts | Pie Chart | Pareto Diagrams |
|---|---|---|---|
 |
 |
 |
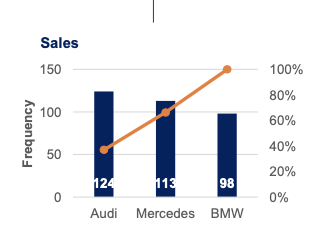 |
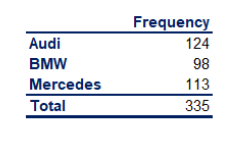
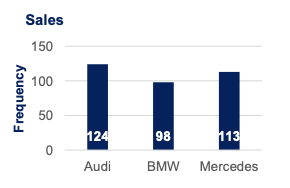
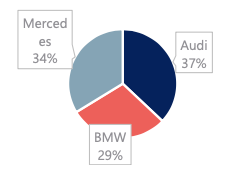
| Frequency distribution tables show the category and its corresponding absolute frequency. | Bar charts are very common. Each bar represents a category. On the y-axis we have the absolute frequency. | Pie charts are used when we want to see the share of an item as a part of the total. Market share is almost always represented with a pie chart. | The Pareto diagram is a special type of bar chart where the categories are shown in descending order of frequency, and a separate curve shows the cumulative frequency. |
| In Excel, we can either hard code the frequencies or count them with a count function. Total formular =SUM() |
Bar charts are also called clustered column charts in Excel. Choose your data, Insert -> Chart -> Clustered column or Bar Chart. |
Pie charts are created in the following way: Choose your data, Insert -> Chart -> Pie Chart |
next section |
IV.PARETO DIAGRAMS IN EXCEL
Creating Pareto in Excel:
- Order the data in your frequency distribution table in descending order.
- Create a bar chart.
- Add a column in your frequency distribution table that measures the cumulative frequency
- Select the plot area of the chart in Excel and
Right Click - Choose
Select series - Click
Add - Series name does not matter. You can out 'Line'
- For
Series valueschoose the cells that refer to the cumulative frequency. - Click
OK. You should see two side-by-side bars. - Select the plot area of the chart and
Right click. - Choose
Change Chart Type - Select
Combo - Choose the type of representation from the dropdown list. Your initial categories should be
Clustered Column. Change the second series, that you called 'Line' to 'Line'
V.NUMERICAL VARIABLES & FREQUENCY DISTRIBUTION TABLE AND
HISTOGRAM
- Frequency distribution tables for numerical variables are different than the ones for categorical. Usually, they are divided into intervals of equal (or unequal) length. The tables, show the interval, the absolute frequency and sometimes it is useful to also include the relative (and cumulative) frequencies.

- The interval width is calculated using the following formula:
Inteval width = (Largest num - Smallest num) / number of desired intervals - Creating the frequency distribution table in Excel:
- Decide on the number of intervals you would like to use
- Find the interval width (using the formula above)
- Start your first interval at the lowest value in your dataset
- Finish your first interval at the lowest value + interval width (
= start_interval_cell + interval_width_cell) - Start your second interval where the first stops (that's a formula as well - make the starting cell of interval 2 = the ending of interval 1)
- Continue in this way until you have created the desired number of intervals.
- Count the absolute frequencies using the following
COUNTIFformula:
=COUNTIF(dataset_range,">="&interval start) -COUNTIF(dataset_range,">"&interval end) - In order to calculate the relative frequencies, use the following formula:
= absolute_frequency_cell / number_of_observations - In order to calculate the cumulative frequencies:
- The first cumulative frequency is equal to the relative frequency
- Each consecutive cumulative frequency
= previous cumulative frequency + respective relative frequency
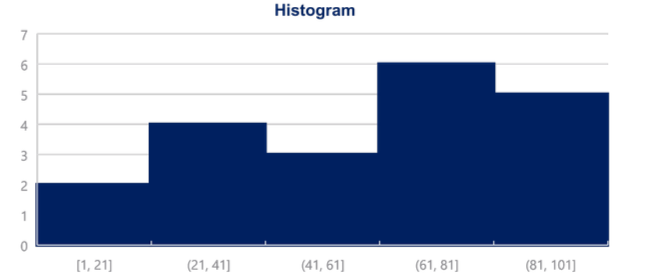
- Histogram: are one of the most common ways to represent numerical data. Each bar has width equal to the width of the interval. The bars are touching as there is continuation between intervals where one ends, the other begins.
- Histogram can have different interval for each group.
- Create Histogram in Excel:
- Choose your data
Insert -> Charts -> Histogram- To change the number of bins (intervals)
- Select the x-axis
- Click
ChartTools -> Format -> Axis Options - You can select the bin width (interval width), number of bins, etc
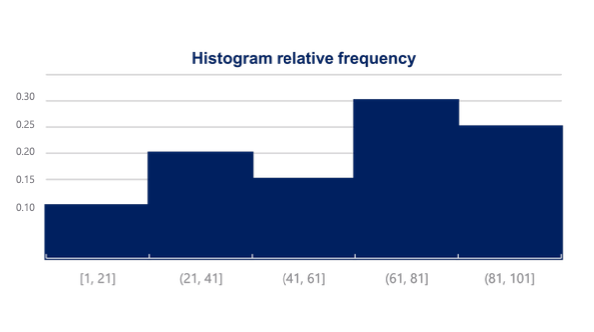
- Histogram with relative frequency
VI.CROSS TABLE
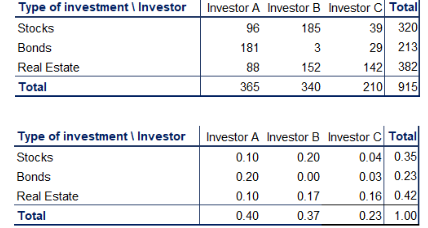
- Cross table: (or contingency tables) are used to represent categorical variables. One set of categories is labelling the rows and another is labelling the columns. We then fill in the table with the applicable data. It is a good idea to calculate the totals. Sometimes, these tables are constructed with the relative frequencies as shown in the table below.
- A common way to represent the data from a cross table is by using a side-by-side bar chart.
- Create a side-by-side chart in Excel:
- Choose your data
Insert -> Charts -> Clustered Column
Selecting more than one series (groups of data) will automatically prompt Excel to create a side-by-side bar (column) chart.
VII.SCATTER PLOTS:
- When we want to represent two numerical variables on the same graph, we usually use a scatter plot. Scatter plots are useful especially later on, when we talk about regression analysis, as they help us detect patterns (linearity, homoscedasticity).
- Scatter Plots usually represent lots and lots of data. Typically, we are not interested in single observations, but rather in the structure of the dataset.
- Creating a scatter plot in Excel:
- Choose the two dataset you want to plot
- Insert -> Charts -> Scatter
| Chart | Description |
|---|---|
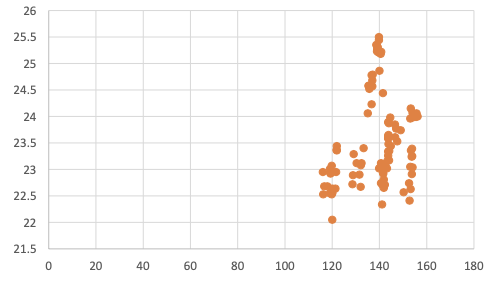 |
Scatter plot shows no pattern because completely vertical 'form' show no associations |
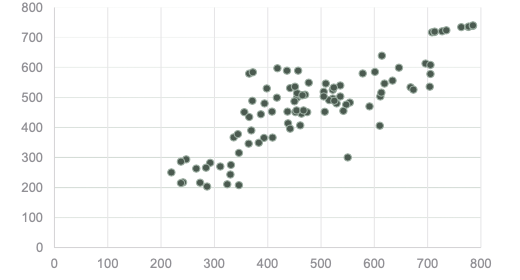 |
Scatter plot that looks in this way shows a linear pattern, meaning that the observations move together. |
VIII.MEAN, MEDIAN, MODE:
-
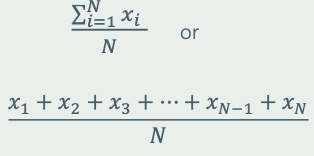
Mean: is the most widely spread measure of central tendency. it is the simple average of the dataset.
- It is easily affected by outliers
- Formula is
- In Excel, to find mean we can use
=AVERAGE()
-
Median: The median is the midpoint of the ordered dataset. It is not as popular as the mean, but is often used in academia and data science. That is since it is not affected by outliers
- In an ordered dataset, the median is the number at position (n+1) / 2
- If this position is not a whole number, it is the simple average of the two number at positions closest to the calculated value.
- In Excel, find median by
=MEDIAN()
-
Mode: is the value that occurs most often. A dataset can have 0 mode, 1 mode or multiple modes.
-
The mode is calculated simply by finding the value with the highest frequency.
-
In Excel, mode is calculated by:
=MODE.SNGL()-> returns one mode -
Or
=MODE.MULT()-> returns an array with the modes. It is used when we have more than 1 mode.
IX.SKEWNESS: -
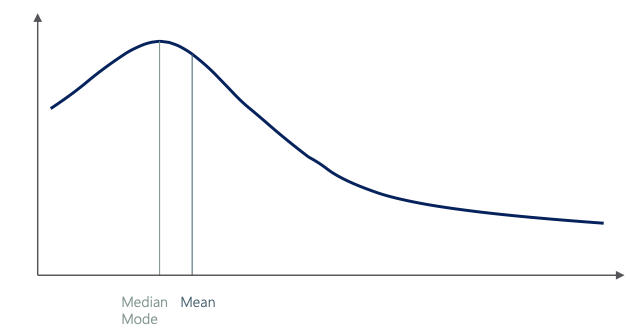
Skewness: is a measure of asymmetry that indicates whether the observations in a dataset are concentrated on one side.
-
Right (positive) skewness looks like the following image. it means that the outliers are to the right (long tail to the right).
-
Left (negative) skewness means that the outliers are to the left.
-
Calculate Skewness in Excel:
=SKEW()
X.VARIANCE AND STANDARD DEVIATION: -
Variance and standard deviation measure the dispersion of a set of data points around its mean value.
-
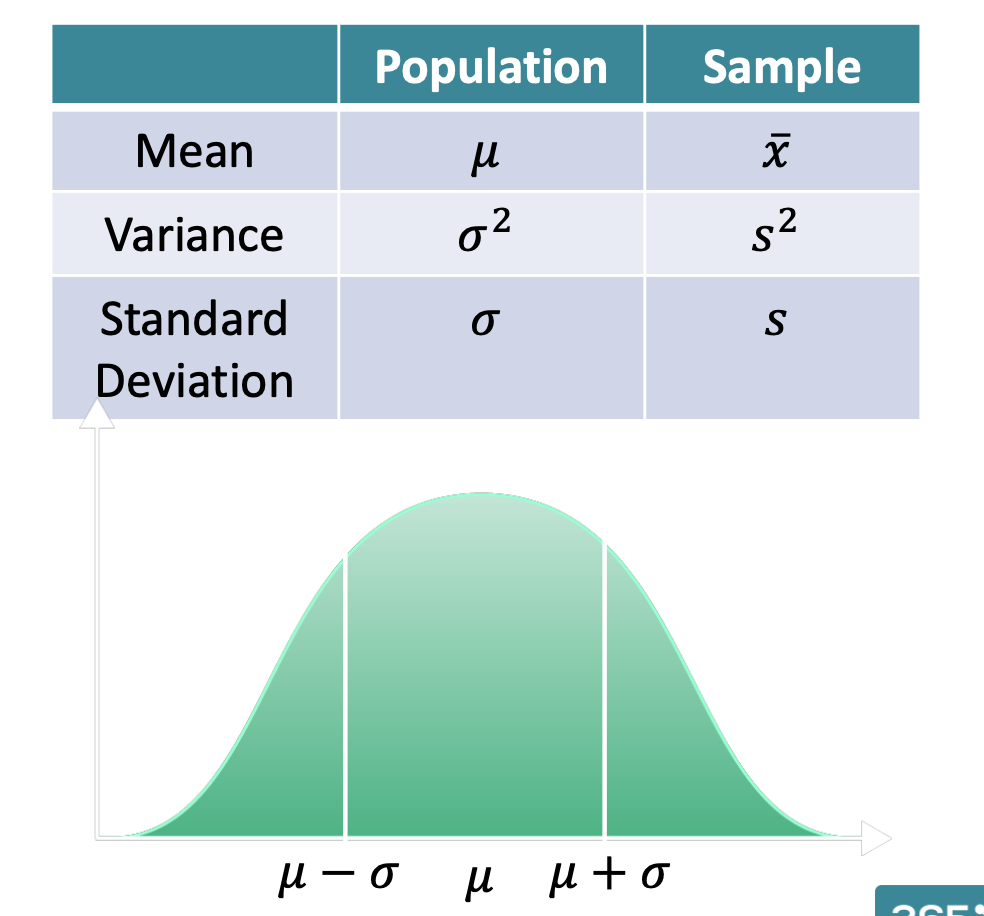
Standard deviation: indicates the distance of (Sample / Population) data points from the mean
-
There are different formulas for population and sample variance & standard deviation. This is due to the fact that the sample formulas are the unbiased estimators of the population formulas
-
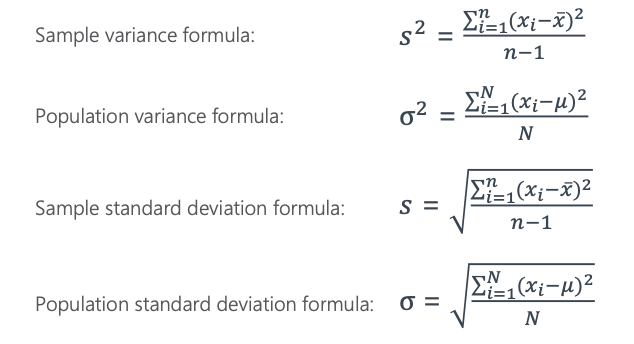
-
Calculating variance in Excel:
- Sample variance:
=VAR.S(): measures the spread of data in a sample (subset of population). - Population variance:
=VAR.P(): measures the spread of all data points in a population. - Sample standard deviation:
=STDEV.S(): measure the spread of data in a sample but in the same unit as the data. - Population standard deviation:
=STDEV.P(): measure the spread of all data points in a population in the same unit as the data.
XI.COVARIANCE AND CORRELATION
- Sample variance:
| Covariance | Correlation |
|---|---|
| Covariance is a measure of the joint variability of two variables. - A positive covariance means that the two variables move together. - A covariance of 0 means that the two variables are independent - A negative covariance means that the two variables move in opposite directions. Covariance can take on values from - infinity to + infinity. This is a problem as it is very hard to put such numbers into perspective.` |
Correlation is a measure of the joint variability of two variables. Unlike covariance, correlation could be thought of as a standardized measure. It takes on values between -1 and 1, thus it is easy for us to interpret the result. - A correlation of 1, known as perfect positive correlation, means that one variable is perfectly explained by the other. - A correlation of 0 means that the variables are independent. - A correlation of -1, known as perfect negative correlation, means that one variable is explaining the other one perfectly, but they move in opposite directions. |
 |
 |
| In Excel: Sample covariance: =COVARIANCE.S()Population covariance: =COVARIANCE.P() |
In Excel:=CORREL() |