R
THE BASIC CONCEPTS OF R
- Functions
- Comments
- Variables
# assignment variable
variable_1 <- "This is variable"
variable_2 <- 3
- Data types
- Vectors: A group of data elements of the same type stored in a sequence in R
# vec_1 is our vector
vec_1 <- c(2, 4, 7, 3.5, 54.5)
- Pipes: A tool in R for expressing a sequence of multiple operations, represented with
"%>%"
DATA STRUCTURE
- Vectors
- Data frames
- Matrices
- Arrays
VECTORS
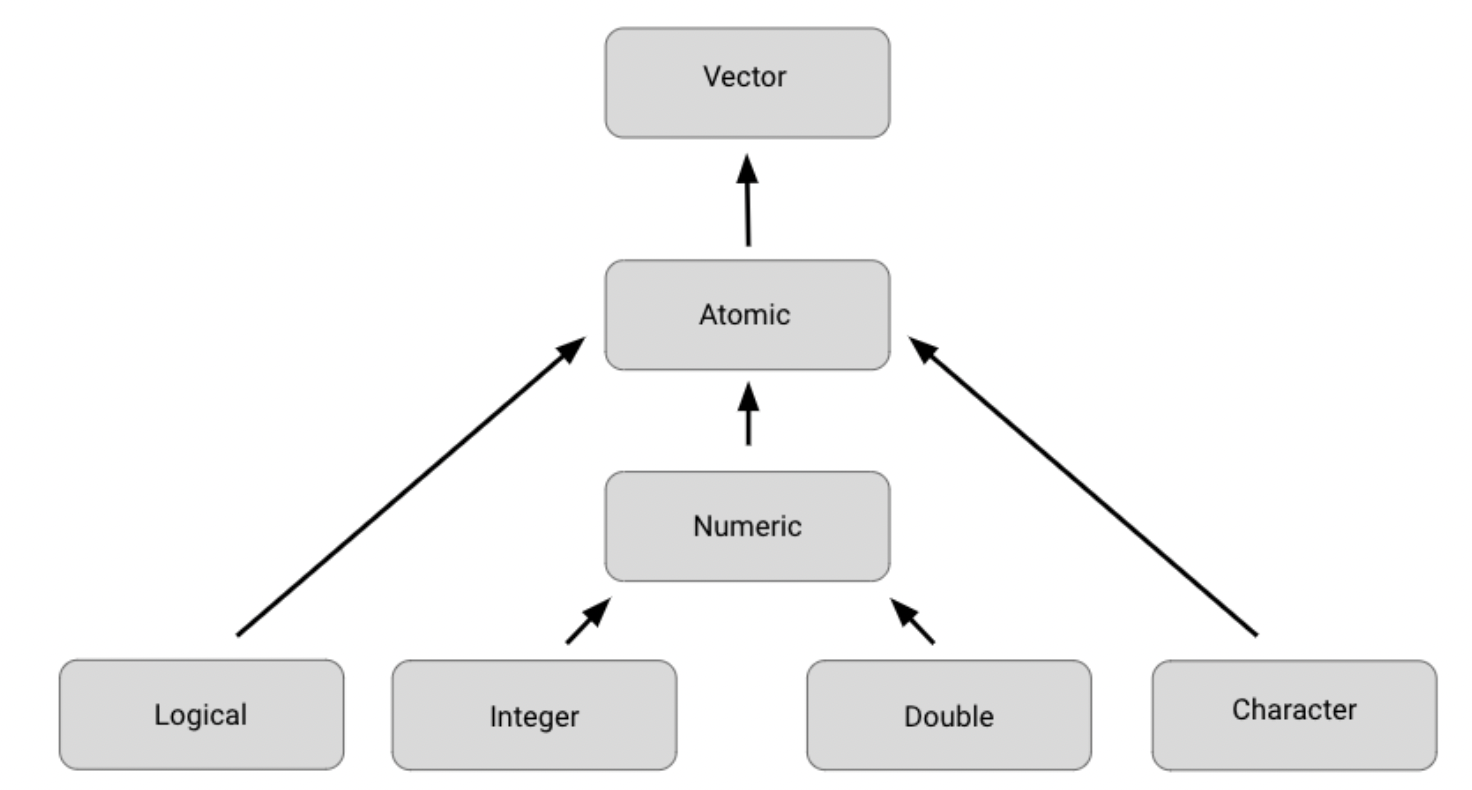
- There are 2 types of vectors: atomic vectors and lists
- vector is a group of data elements of the same type, stored in a sequence in R. You cannot have a vector that contains both logicals and numerics
- There are six types of vectors: logical, integer, double, character(contains strings), complex, and raw.
| Type | Description | Example |
|---|---|---|
| Logical | True/False | TRUE |
| Integer | Positive and negative whole values | 3 |
| Double | Decimal values | 101.751 |
| Character | String/character values | "Coding" |
 |
-
Creating vectors:
- Using the
c()(combine function) - For example, you can use the c() function to store numeric data in a vector
c(2.5, 48.5, 101.5 - To create a vector of integers using the c() function, you must place the letter "L" directly after each number
c(1L, 5L, 15L) - You can also create a vector containing characters or logicals
c("Sara", "Lee", "Anna")
c(TRUE, FALSE, FALSE)
- Using the
-
Determining the properties of vector:
- Every vector you create will have two key properties: type and length
- You can determine what type of vector you are working with using the
typeof()function
typeof(c("a","b"))
#> [1] "character"
Notice that the output of thetypeoffunction in this example is "character". Similarly, if you use thetypeoffunction on a vector with integer values, then the output will include "integer" instead:
typeof(c(1L, 5L))
#> [1] "integer" - You can determine the length of an existing vector-meaning the number of elements it contains- by using the
length()function.
x <- c(33.5, 57.75, 120.05)
length(x)
#> [1] 3 - You can also check if a vector is a specific type by using an is function:
is.logical(), is.double(), is.integer(),is.character()
-
Creating Lists
- Lists are different from atomic vectors because their elements can be of any type - like dates, data frames, vectors, matrices, and more. Lists can contain other lists.
- You can create a list with the
list()function.
list("a",1L, 1.5, TRUE)
list(list(list(1 , 3, 5)))
-
Determining the structure of lists
- If you want to find out that types of elements a list contains, you can use the
str()function.
str(list("a", 1L, 1.5, TRUE)
Our result is: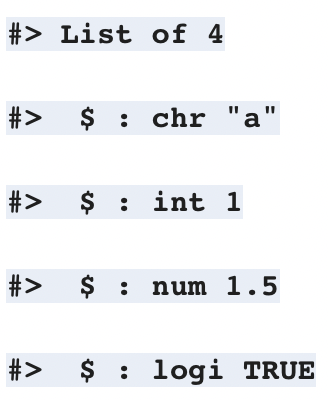
- Let's use the str() function to discover the structure of our second example.
z <- list(list(list(1 , 3, 5))) - Run
str(z)
Our result is: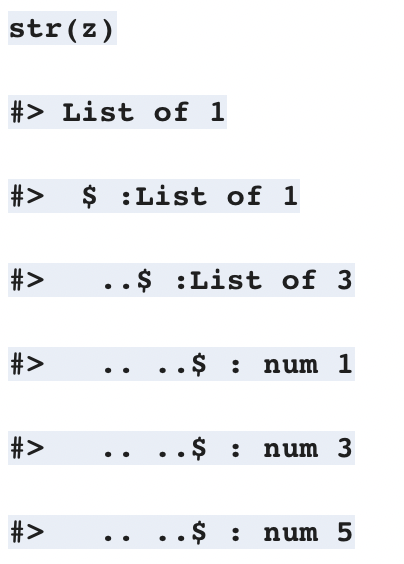
The indentation of the $ symbols reflect the nested structure of this list. Here, there are 3 levels (so there is a list within a list within a list)
- If you want to find out that types of elements a list contains, you can use the
-
Naming list:
- Lists, like vectors, can be named:
list('Chicago' = 1, 'New York' = 2, 'Los Angeles' = 3 )
- Lists, like vectors, can be named:
DATE AND TIME
-
Types:
- A date
("2016-08-19") - A time within a date
("20:11:23 UTC") - And a date-time. This is a date plus a time
("2018-03-29 18:13:55 UTC") today()function gives you a datenow()function gives you a current date-time
- A date
-
Converting from strings:
ymd("January 20th, 2021")gives you the date inyyyy-mm-ddformat.ymd_hms("01/20/2021 08:01")gives you the date in date-time format.as_date()converts a date-time to a date.
-
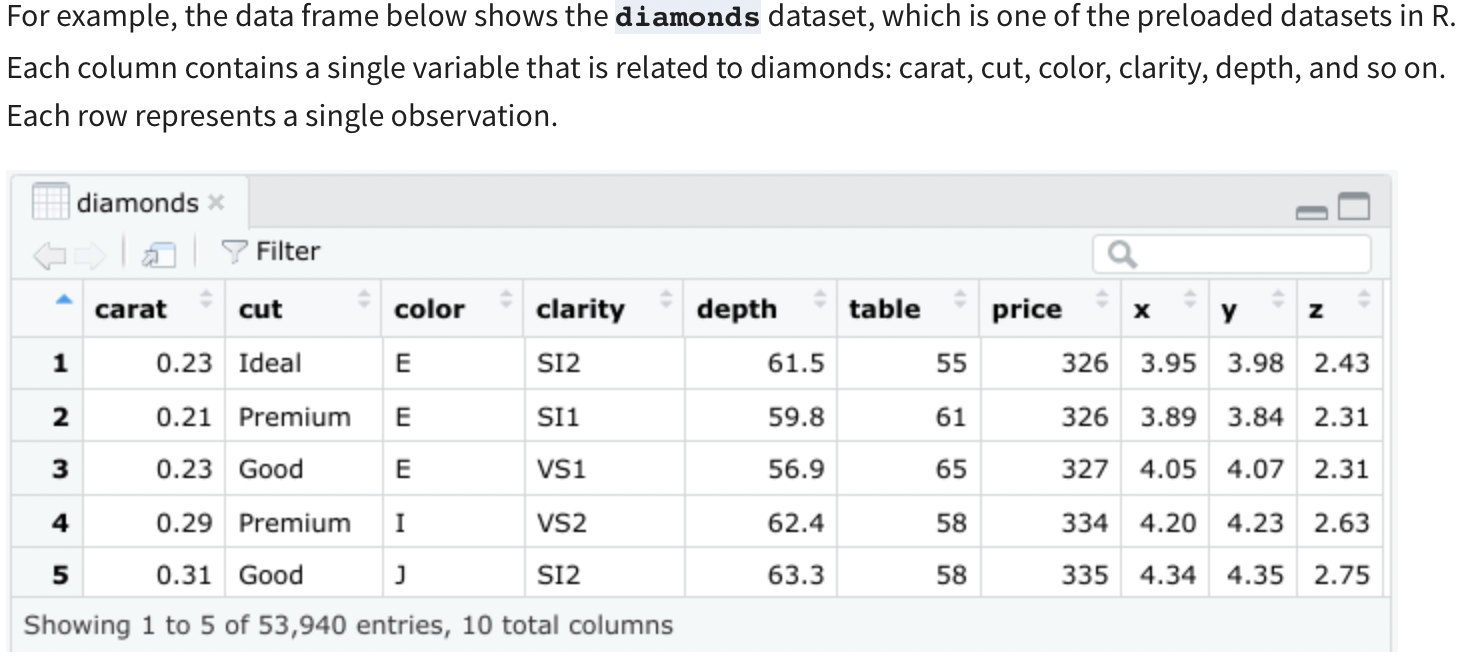
Data frames
-
Data frames are the most common way of storing and analyzing data in R, so it's important to understand what they are and how to create them. A data frame is a collection of columns containing data, similar to a spreadsheet or SQL table. Each column has a name that represents a variable and includes one observation per row. Data frames summarize data and organize it into a format that is easy to read and use.
There are a few key things to keep in mind when working with data frames: -
Data frames can include many different types of data, including numeric, logical, or character.
-
Data frames can have only one element in each cell.
-
Each column should be named.
-
Each column should consist of elements of the data data type.
z <- data.frame(x = c(1,2,3), y = c(1.5, 2.5, 7.5))gives you a 2 column. -
You can extract the element from the second row and the fist column, use the
z[2,1] -
Create a file: Use
file.create("filename.csv") -
Copy a file: Use
file.copy("filename.txt", "destination_folder") -
Delete file: Use
unlink("some_file.csv") -
Matrices:
- A matrix is a two-dimensional collection of data elements. This means it has both rows and columns. By contrast, a vector is a one-dimensional, sequence of data elements. But like vectors, matrices can only contain a single data type. For example, you can't have both logicals and numerics in a matrix.
- Use the
matrix()function, then add at least one matrix dimension. You can choose to specify the number of rows ore the number of column by using the codenrow =orncol =.
matrix(c(3:8), nrow = 2)
matrix(c(3:8), ncol = 2)
-
facet_wrap() is a function used to create subplots, which are individual plots that represent a specific part of a broader data set.
geom_point() function is used in the ggplot2 package to create scatter plots or plots with individual points
ggplot(data, aes(x = <x-variable), y =<y-variable>)+
	geom_point()
Common arguments:
mapping: Used to map aesthetic (aes(x, y, color, size)) color: sets the color of points size: sets the size of points shape: changes the shape (circles, triangles) alpha`: adjusts the transparency of points
-
8 core
tidyversepackages:ggplot2: Create a variety of data visualization by applying different visual properties to the data variables in Rtibbletidyr: A package used for data cleaning to make tidy datareadr: Used for importing data (e.gread_csv(): Import acsvinto R)purrrdplyr: Offers a consistent set of functions that help you complete some common data manipulation tasks (select(),filter())stringrforcats
-
Use Pipes to nest code:
- Pipe: A tool in R for expressing a sequence of multiple operations, represented with "%>%"
- Nested: In programming, describes code that performs a particular function and is contained within code that performs a broader function.
- When using pipe:
- Add the pipe operator at the end of each line of the piped operation except the last one.
- Check your code after you've programmed your pipe.
- Revisit piped operations to check for parts of your code to fix
DATA FRAMES:
-
Data frame: Is a collection of columns
- Columns should be named
- Data stored can be many different types, like numeric, factor, or character
- Each column should contain the same number of data items
-
head(): to view the first 6 rows of the data -
mutate(dataset, new_col=old_col+1): to make change to our data fram -
str(dataset): to see high level structure of each variable in the dataset -
colnames(dataset): to see all the column names
TIBBLE
- Use
as_tibble(dataset)to turn a dataset intotibbleformat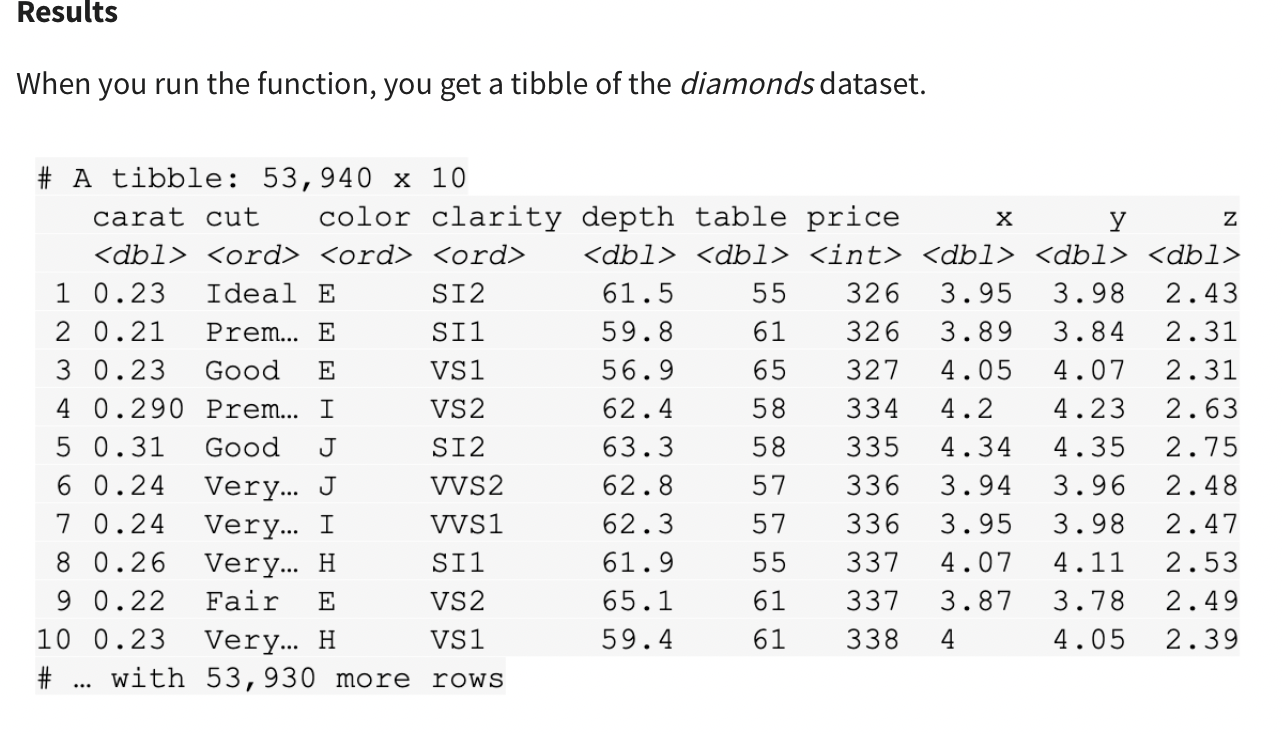
DATA-IMPORT BASICS:
-
The
data()function: If you want to load a specific dataset, just enter its name in the parentheses of the data() function. -
The
readrpackage:.csv(comma separated values): Is a plain text file that contains a list of data. They mostly use commas to separate (or delimit) data, but sometimes they use other characters, like semicolons..tsv(tab separated values): stores a data table in which the columns of data are separated by tabs. For example, a database table or spreadsheet data..fwf(fixed width files): has a specific format that allows for the saving of textual data in an organized fashion..log: is a computer-generated file that records events from operating systems and other software programs.readrfunctions:read_csv(): comma-separated values filesread_tsv(): tab-separated values filesread_delim(): general delimited filesread_fwf(): fix-width filesread_table(): tabular files where columns are separated by white-spaceread_log(): web log files
-
**
readxlfunctions:- Use
read_excel()to read excel file - Use
excel_sheet()to see the name of individual sheets
- Use
-
pivot_longer()andpivot_wider()function to change data from wide to long and vice versa.
GGPLOT2
-
Core concept:
- Aesthetics: The visual property of an object in your plot
Geoms: the geometric object used to represent your data- Facets: let you display smaller groups, or subsets, of your data
- Labels and annotations: text, title, subtitle
-
Example:
ggplot(data= penguins) +geom_point(mapping= aes(x= flipper_length_mm, y= body_mass_g))
-
ggplot(data=penguins): Inggplot2, you begin with a plot with theggplot()function creates a coordinate system that you can add layers to. The first argument of theggplot()function is the dataset to use in the plot. In this case, it's "penguins" -
Then you can add a "+" symbol to add a new layer to your plot. You complete your plot by adding one or more layers to
ggplot() -
geom_point(): Next, you choose ageomby adding ageomfunction. Thegeom_point()function uses points to create scatterplots, thegeom_barfunction uses bars to create bar charts and so on. In this case, choose thegeom_point()function to create a scatter plot of points. -
(mapping = aes(x = flipper_length_mm, y = body_mass_g): Eachgeomfunction inggplot2takes a mapping argument. This defines how variables in your dataset are mapped to visual properties. The mapping argument is always paired with the aes() function. The x and y arguments of the aes() function specify which variables to map to the x-axis and the y-axis of the coordinate system. In this case, you want to map the variable "flipper_length_mm" to the x-axis, and the variable "body_mass_g" to the y-axis. -
?geom_pointto get help from R Studio -
Common aesthetic for points
- X
- Y
- Color
- Shape
- Size
- Alpha -
Geomfunctions-
geom_point -
geom_bar: R counts how many times each x-value appears in the data, and then shows the counts on the y-axis -
geom_line -
geom_smooth
- Loess smoothing: best for smoothing plots with less than 1000 points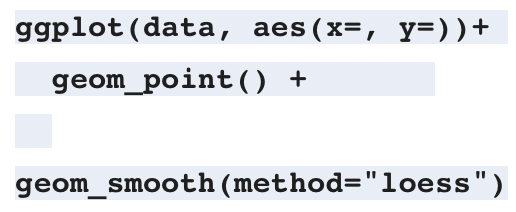
- Gam smoothing: generalized additive model smoothing, is useful for smoothing plots with a large number of points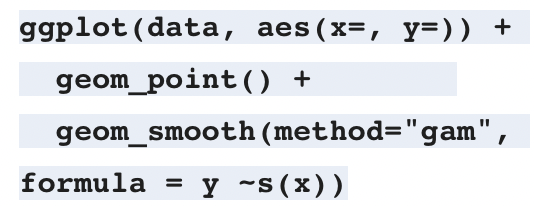
-
geom_jitter: creates a scatterplot and then add a small amount of random noise to each point in the plot, which happens when the data points overlap with each other.
-
-
Facetfunctions:facet_wrap: create a separate plot for each categories of a variablefacet_grid: create a separate plot for 2 or more variable(s) then a separate plot for each categories of such variable(s)- Tilde
~operator is used to define the relationship between dependent variable and independent variables in a statistical model formula. The variable on the left-hand side of tilde operator is the dependent variable and the variable(s) on the right-hand side of tilde is/are called the independent variable(s). So, tilde operator helps to define that dependent variable depends on the independent variable(s) that are on the right-hand side of tilde operator.
-
labs(): function allows us to add label to our code
e.g:labs(title='abc', subtitle='xyz') -
annotate()to add note or annotation to your chart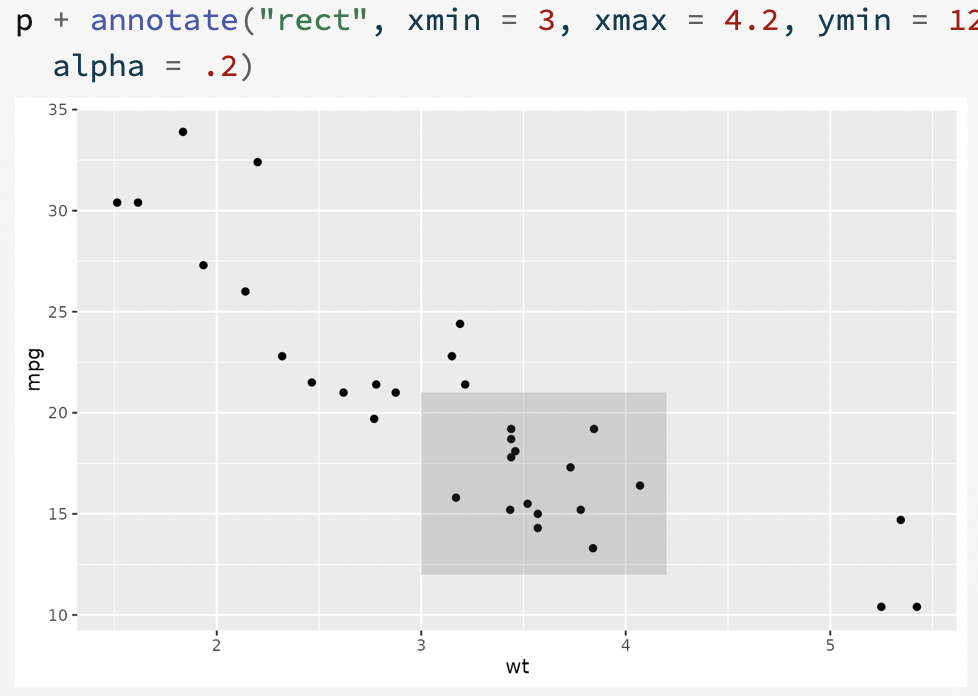
-
Save a plot
ggsave(example.png)
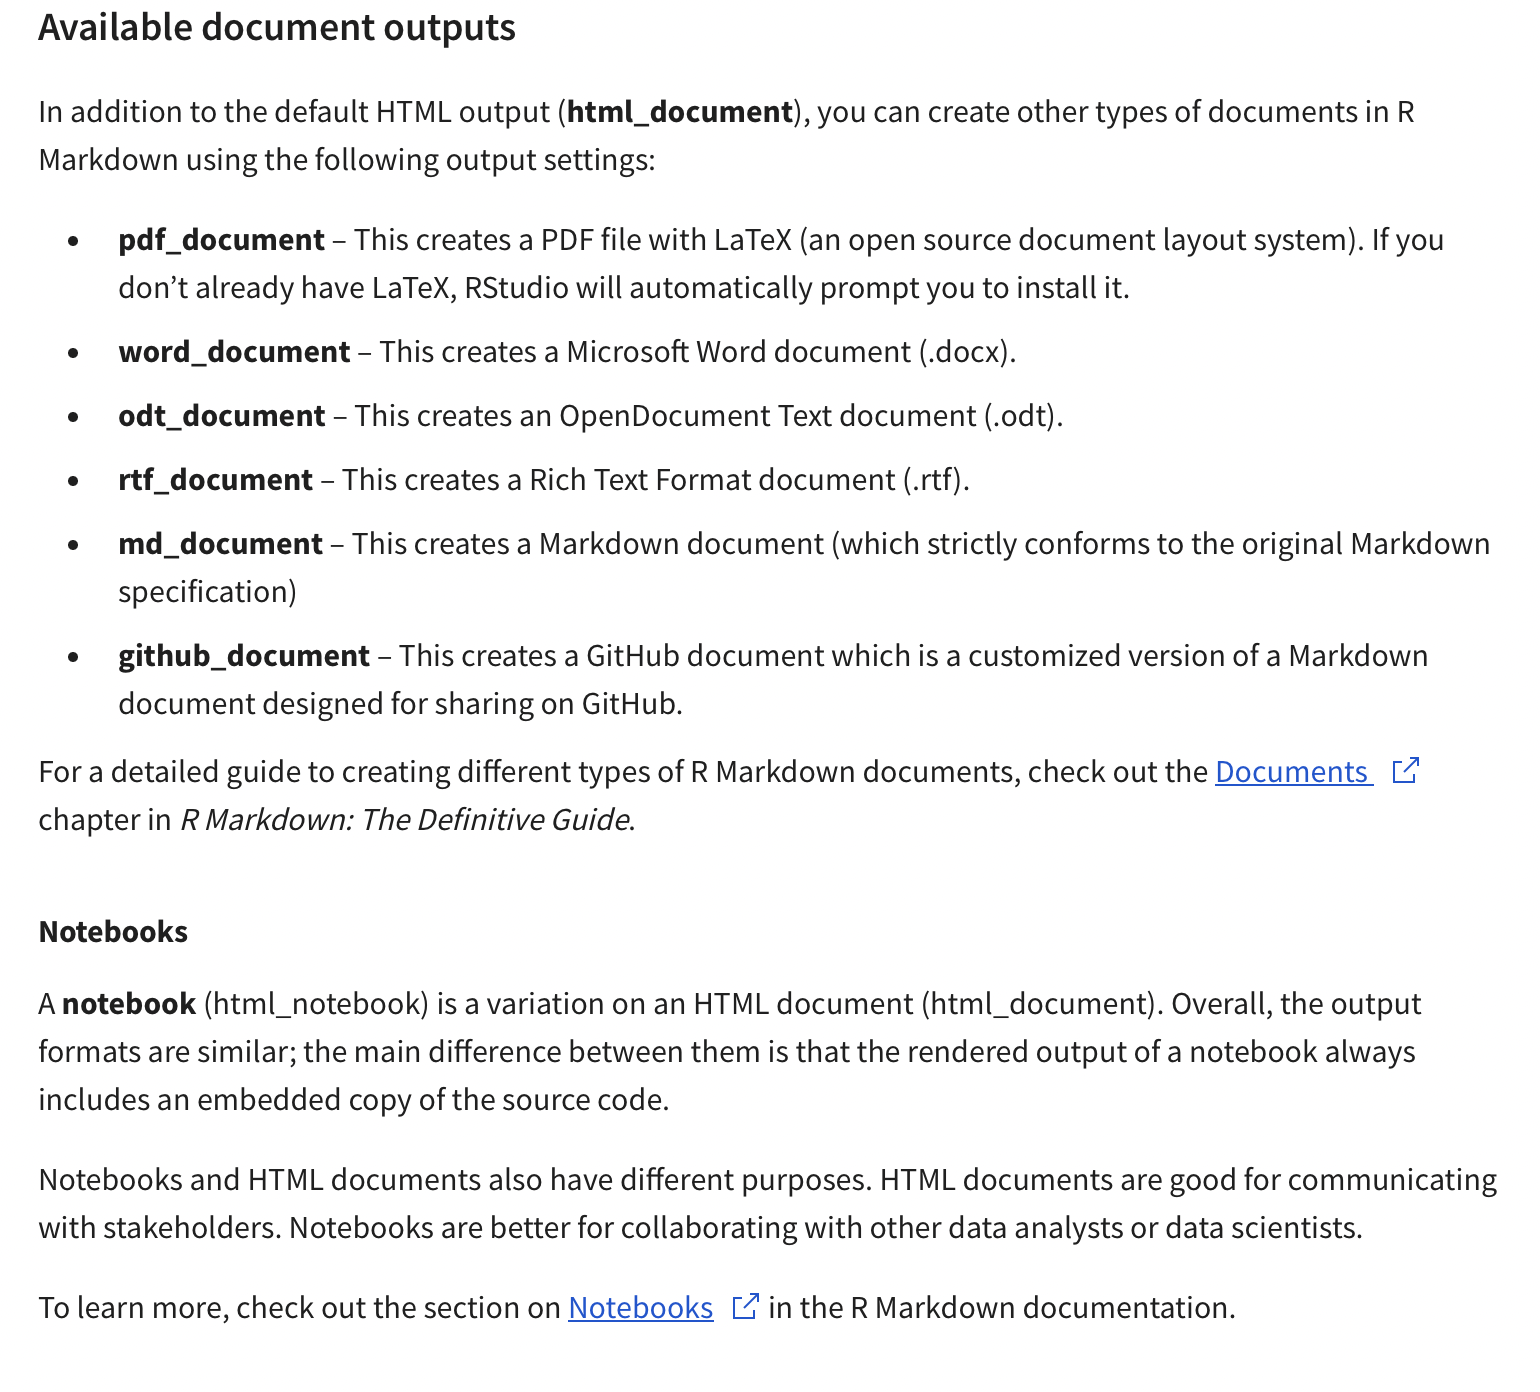
R MARKDOWN
- Refer to this to create a link: link